What can visualisation do? The work of Otto and Marie Neurath
The ordinary citizen ought to be able to get information freely about all subjects in which he is interested, just as he can get geographical knowledge from maps and atlases. There is no field where humanisation of knowledge through the eye is not possible“ (Neurath, O. 1939: 3).
We are in the midst of a big data delirium. Data are increasingly mobilized in all sorts of conversations and decision-making processes. More often than not, data are presented to the public through data visualisations. Data visualisations, like the data on which they are based, are becoming increasingly ubiquitous.
If data visualisations are the main source of popular access to data, we need to develop our understanding of how people interact with them – this is the aim of Seeing Data. We’re especially interested in the role that data visualisations play in everyday life and for ordinary people, because we’re interested in whether visualisations can offer people a way to get involved in the data conversations that are increasingly taking place around them.
In thinking about what visualisations can do, about whether they can be mobilized to enable public engagement and understanding, the work of Austrian philosopher Otto Neurath is informative. Neurath had an amazing career, as a professor of political science, director of War Economy, writer, philosopher of science, economic planner, secretary of a housing and gardens association and, most relevant to Seeing Data, a museum director and proponent of a graphical language he called Isotype.
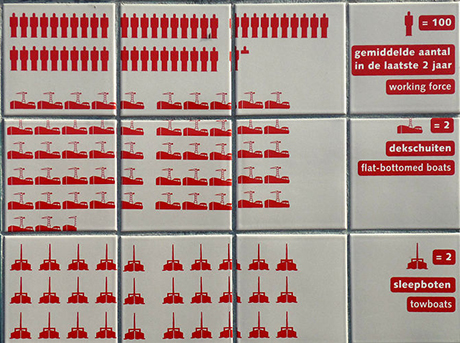
Isotype is a visual way of representing quantitative information via icons, which Neurath felt could become an international picture language. He believed that ‘visual education is related to the extension of intellectual democracy within single communities and within mankind’ (Neurath, O. 1973: 247).
Neurath worked closely with Marie Reidemeister, who became his third wife, Marie Neurath in 1941, and who continued their work on Isotypes after his death. Together they aimed to put their ideas about graphical language into practice in the museums Neurath directed, such as the Museum of Society and Economy in Vienna. Marie Neurath said of their intentions in relation to their museum work:
Our object was to make the general public acquainted with the problems the community of Vienna had to tackle […] how they were dealt with, and with what success. In colourful charts, which were like simple puzzles which everybody could solve, such problems were brought nearer to general understanding than would have been possible with just words and numbers” (Neurath, M. 1974: 130).
In an article called ‘Diagrams for the Masses’ (2008), Zambrano and Engelhardt link the ideas of the Neuraths to contemporary projects like Al Gore’s use of diagrams about climate change in An Inconvenient Truth and Ola, Anna and Hans Rosling’s GapMinder, which describes itself as ‘a modern “museum” on the Internet’ aiming to promote global sustainable development by visualising related statistics. Another current example is Periscopic, the US-based information visualisation agency whose strap line is ‘do good with data’ and whose clients include organisations doing good work, for example in relation to environmental change, sustainability or human rights.
Zambrano and Engelhardt describe Neurath’s ideas about how accessing data through visuals can be empowering as a form of idealism. Is this idealistic, or does the visual (rather than textual) dissemination of data play a role in social transformation, as Neurath and the Roslings believe? Can visualisations go beyond the eye and hit the brain, to paraphrase Rosling and others (2004: 2)? These are important questions about whether digital and visual technologies can play a role in bringing about social change.
Further reading
GapMinder, http://www.gapminder.org/
Neurath, M. (1974) ‘Isotype’, Instructional Science, 3.
Neurath, O. (1939) Modern Man in the Making, AA Knopf: New York
Neurath, O. (1973) Empiricism and Sociology, in Neurath M & Cohen RS (eds) Vienna Circle Collection, vol 1, Dordrecht: Reidel,
Periscopic: do good with data, http://www.periscopic.com/
Rosling, H. et al (nd) ‘New software brings statistics beyond the eye,’ in OECD World Forum on Key Indicators, http://www.oecd.org/dataoecd/39/48/33843977.doc
Zambrano, RN & Engelhardt, Y (2008) ‘Diagrams for the Masses: Raising Public Awareness – from Neurath to Gapminder and Google Earth’, in Stapleton G et al (eds) Diagrams, Berlin: Springer-Verlag.