Taking time with visualisation
Layout
We now take a look at the overall structure of the visualisation content.
- For static visualisations ask, how is the visualisation laid out on the page? Is the range or sequence of content logical? Is there a clear hierarchy for the positions and sizes of the elements on the page? Is there too much or too little on the page?
- For interactive visualisations ask, what do the interactive aspects do? Are there multiple tabs, pages or layers behind this initial page? Is the sequence of content logical? Is the most revelant and important information on the first page or do you have to navigate further to get to the best bits?
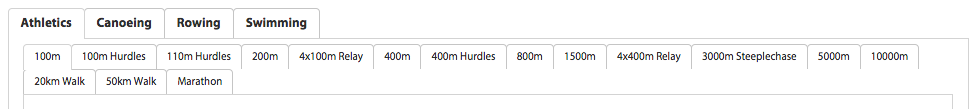
In the ‘Pursuit of Faster’ project, we see there are multiple tabs at the top, one for each of the 4 sports being analysed. Clicking on each one opens up a new set of sub-tabs beneath for each specific event within the chosen sport.
