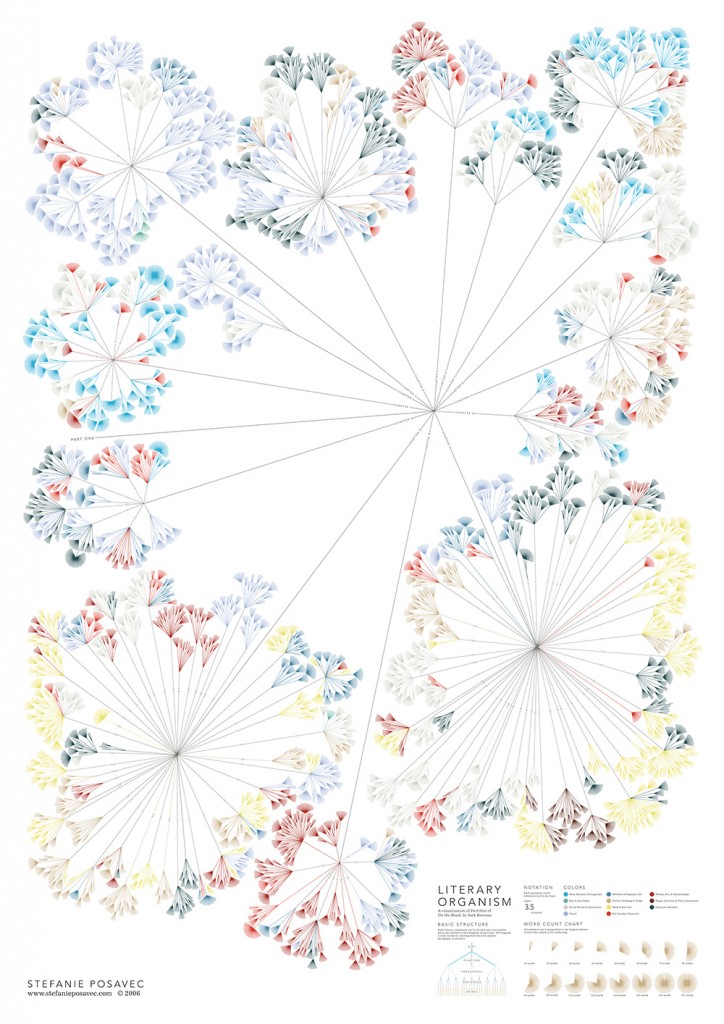
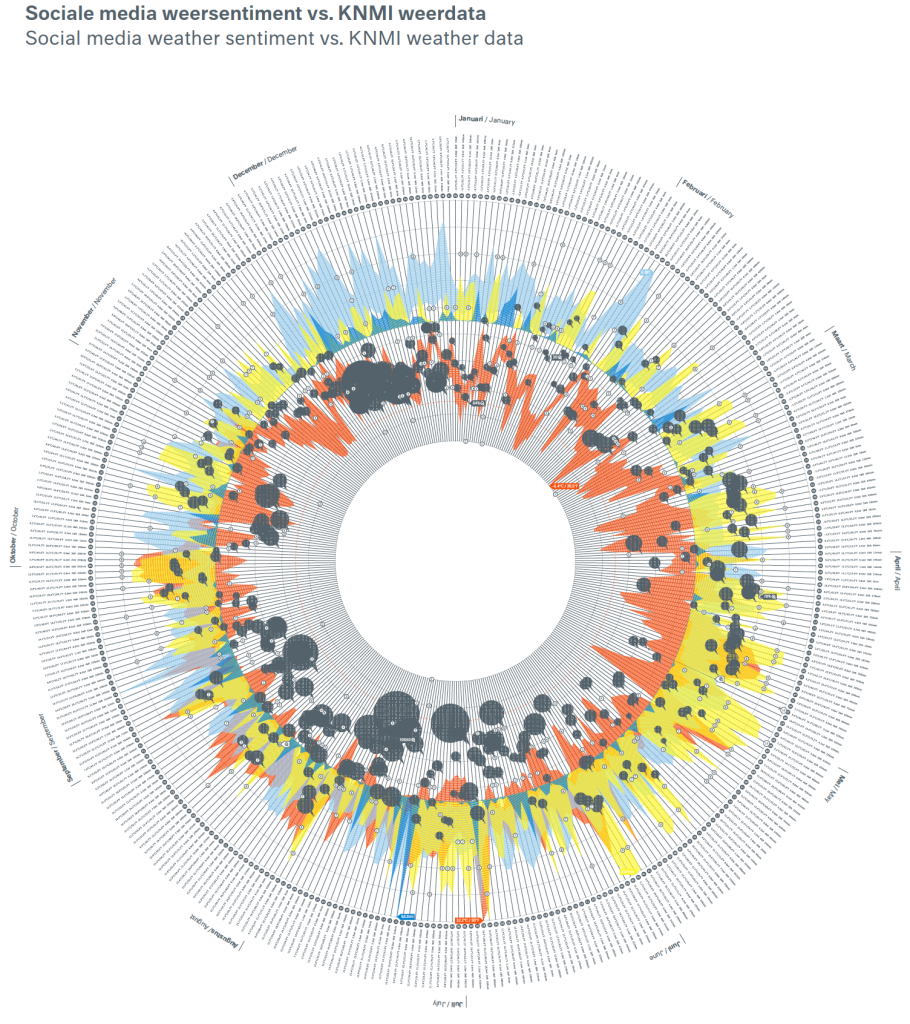
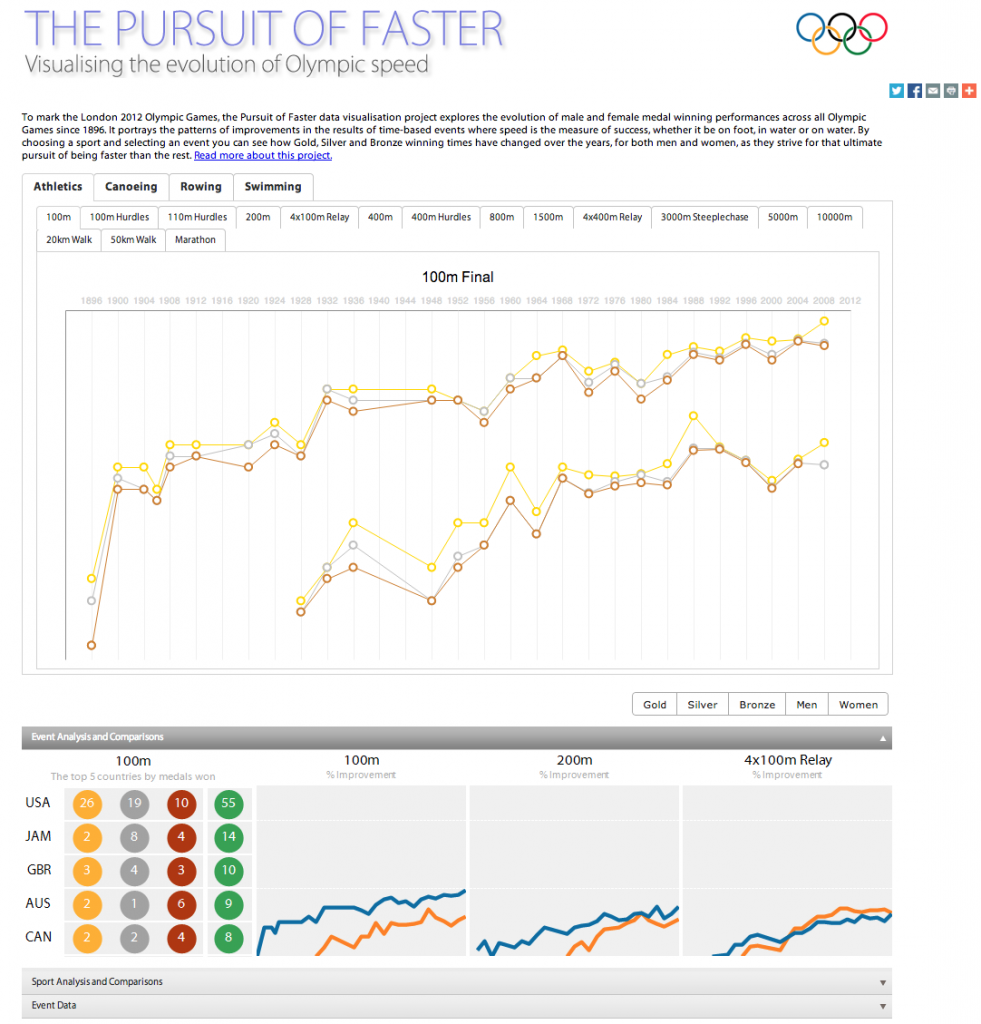
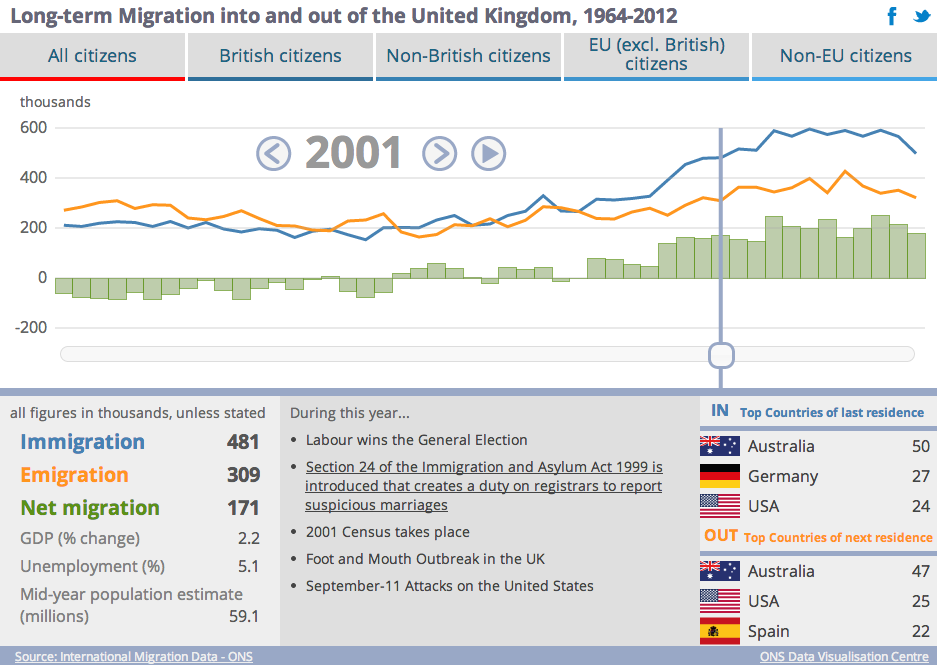
Seeing Data is a group of research projects which aim to understand the place of data visualisations (like those in the examples below) in society. This website includes information about projects which have been completed, are currently underway, or are about to start. It also includes, in the first section, resources to help non-experts develop their ability to make sense of data visualisations.
‘Understanding Data Visualisations‘ is a resource which aims to help people make sense of data visualisations. It’s for the general public – people who are interested in visualisations, but are not experts in this subject.
‘Original Seeing Data Research’ is about the research that we carried out on the original Seeing Data project, how we went about it, and what we found out.
‘Relating to Data Through Visualisation’ is about a new network of three PhD projects addressing different aspects of how people relate to visualisations.
‘Innovative Datavis in the News’ is about uses of data visualisation in news reporting in Norway and in the UK.
‘Persuasive Data’ is about forthcoming research looking at the uses of data visualisation in abortion debates.
Our ‘Seeing Data Blog’ contains regular updates about our ongoing activities and other relevant data visualisation news.
view original


