Home » Seeing Data Blog
Seeing Data Blog
by Helen Kennedy
• June, 26th 2018
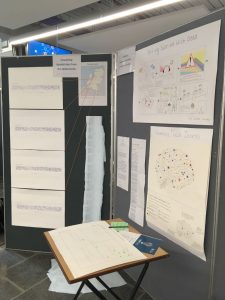
It can be difficult to find ways of engaging members of the public in your research, particularly when you are an early career researcher. The University of York runs a competition called Spotlight that provides a platform for PhD students to promote their research to the general public and other academics. Spotlight runs every yearcontinue reading »
by Helen Kennedy
• September, 26th 2017
I first became aware of the Seeing Data research whilst undertaking a visualisation module within the Centre for Interdisciplinary Methodologies whilst working towards my masters degree in Digital Media and Culture. At this point I was still relatively new to the area of visualisation research but was instantly interested in the themes and papers producedcontinue reading »
by Lulu Pinney
• February, 9th 2017
About this time last year on a Wednesday morning a tweet caught my eye: 3 funded PhDs in ‘relating to data through visualisation’! Exciting! Please come learn with us. I knew it was connected to the Seeing Data conference that I’d enjoyed the previous Autumn. And I’m always keen to support anything datavis-related close tocontinue reading »
by Helen Kennedy
• January, 18th 2017
In November I went to the kick-off meeting for a three-year research project called INDVIL (= Innovative Data Visualisation and Visual-Numeric Literacy) which is funded by the Norwegian Research Council and hosted at the University of Agder in Kristiansand, southern Norway. INDVIL is led by Martin Engbretsen. Through theoretical and empirical studies, INDVIL will explorecontinue reading »
by Helen Kennedy
• November, 16th 2016
I am in week four of a three year PhD exploring how diverse users engage with and draw meanings from data visualisations. My project forms part of the ‘Relating to Data’ network which I joined in October after completing a masters in social research. Although I am coming at this project with a sociological backgroundcontinue reading »
by Helen Kennedy
• August, 26th 2016

By Rosemary Lucy Hill (This short article is adapted from The Work that Visualisation Conventions Do by Helen Kennedy, Rosemary Lucy Hill, Giorgia Aiello and Will Allen. It first appeared on University of Leeds’ Centre for Health, Technology and Social Practice blog on 23rd March 2016.)1 In our digital world, data are becoming increasingly valuedcontinue reading »
by Helen Kennedy
• July, 3rd 2016
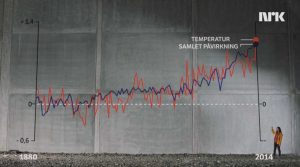
What is the current status of data visualisation in the news? What do they look like? How are they designed and produced? What discursive work do they perform? And how are they read? These questions are at stake in the project Innovative Data Visualisation in the News, funded by the Norwegian Media Authorities and conductedcontinue reading »
by Helen Kennedy
• April, 11th 2016
It’s been a long time since we’ve blogged about our Seeing Data research, as we have been busy analysing, blogging, writing and talking about our findings. We have one journal article out and several more submitted or accepted. We’ve blogged, podcasted and webinared about some of the things emerging from our research, as listed below,continue reading »
by Helen Kennedy
• June, 24th 2015
What: webinar about Seeing Data research findings When: 1st July 2015, 3pm BST Where: online via Adobe Connect Who: academics and visualisers interested in data and visualisation To participate: email seeingdata@leeds.ac.uk On 1st July 2015 at 3pm BST we will be holding a webinar to disseminate and discuss what we have found out on thecontinue reading »
by Helen Kennedy
• May, 7th 2015
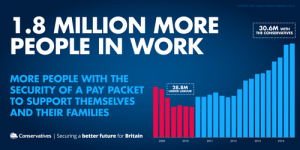
I’ve been looking at the visualisations used by British political parties in the run up to today’s UK General Election on 7th May. Some parties use visualisations in their manifestos, some on their website, some don’t use them. What can a semiotic analysis of these visualisations tell us about how the parties want to presentcontinue reading »