The Global Flow of People
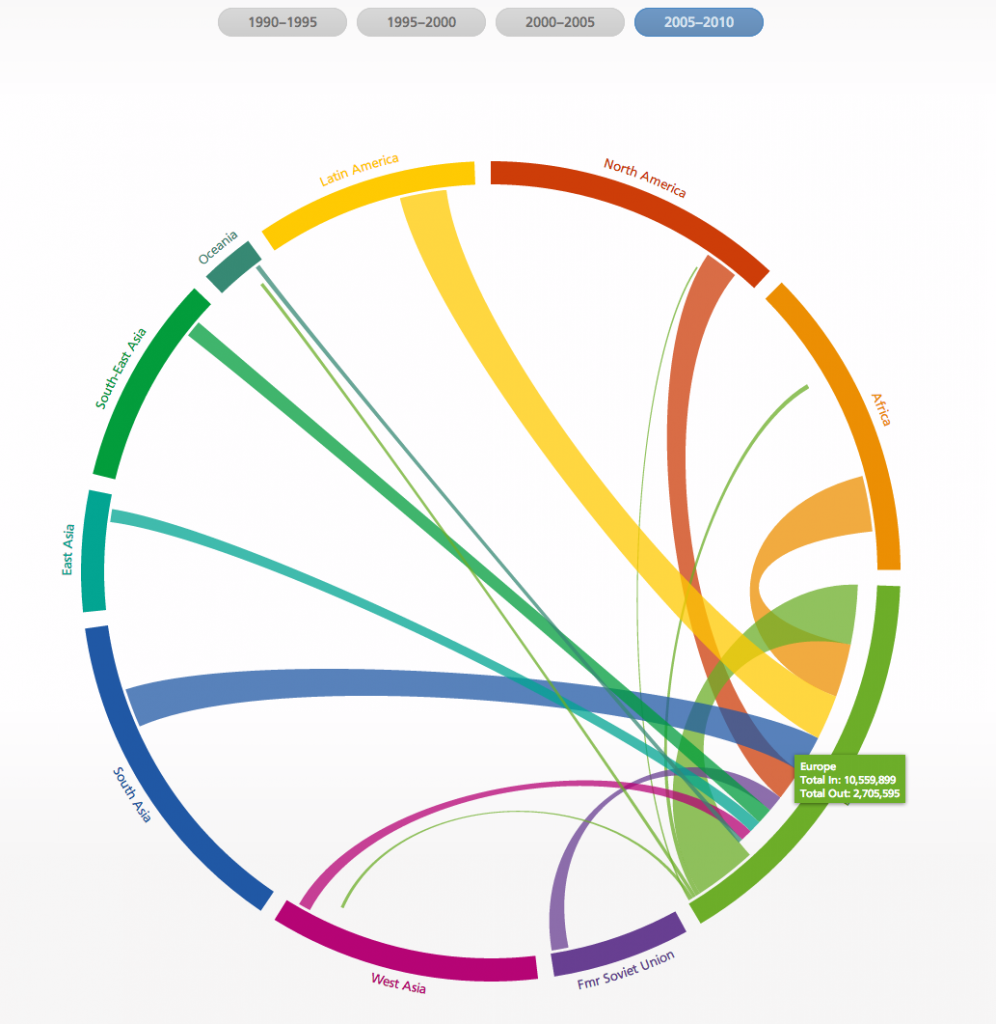
Interactive chord-diagram that shows estimates of migration flows between and within regions and countries for five-year periods, between 1990 and 2010.
Making sense
of data visualisations
Interactive chord-diagram that shows estimates of migration flows between and within regions and countries for five-year periods, between 1990 and 2010.