Map your moves
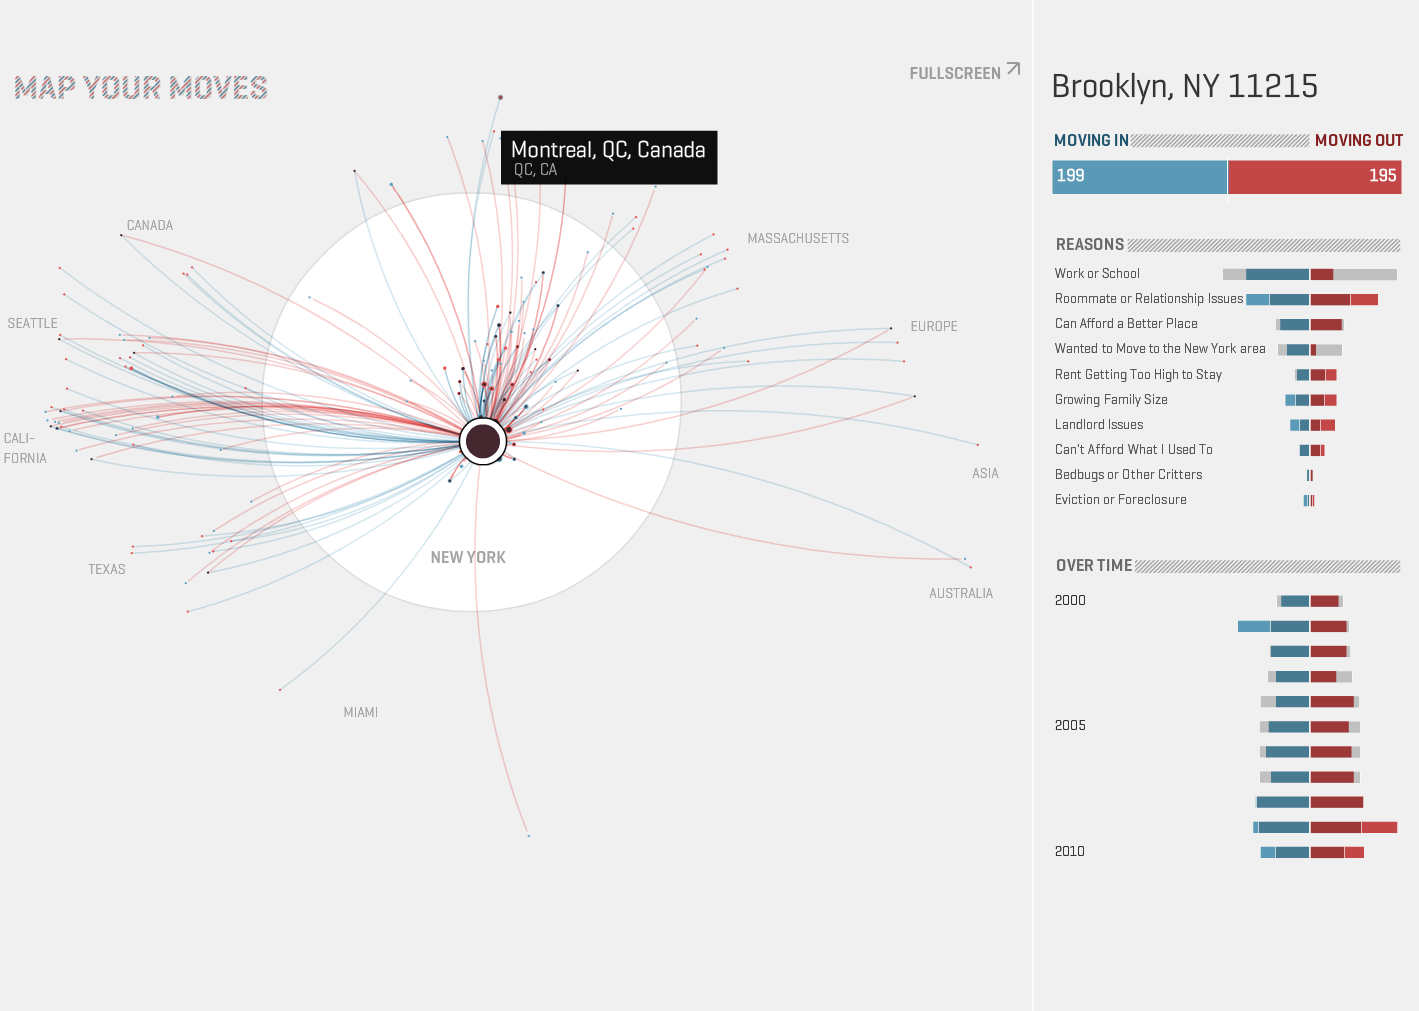
Interactive bubble plot/network map that provides a visual exploration of where New Yorkers moved in the last decade. The map distills more than 4000 moves from over 1700 people, collected in an informal survey by WNYC, a New York based public radio station, showing movements in and out of an area and reasons for the move.