ONS Census map analysis – passports held
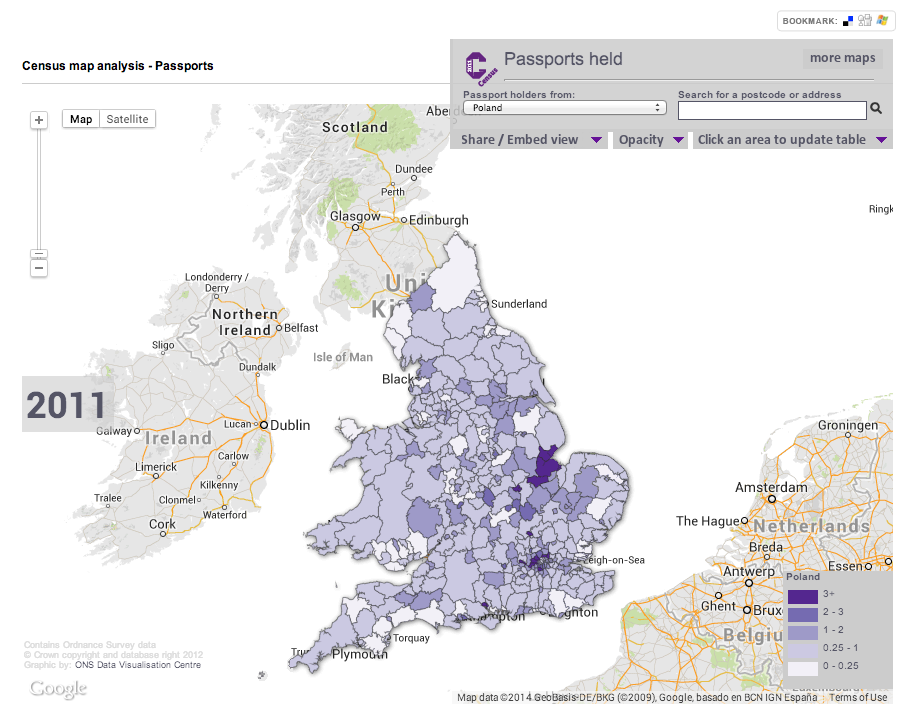
Interactive zoomable Choropleth map showing the percentage of residents in each council region who hold passports from different countries. Produced by the Office for National Statistics Data Visualisation Centre.