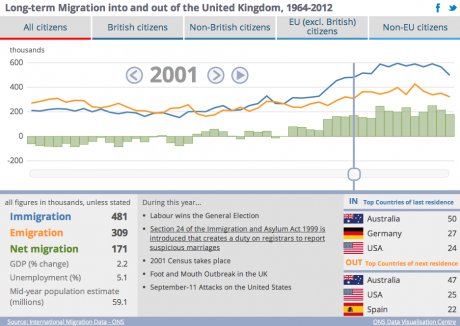
Long-term migration into and out of the United Kingdom

Animated bar and line chart showing long-term migration into and out of the United Kingdom between 1964-2012. Filters are used for different cohorts. Produced by the Office for National Statistics Data Visualisation Centre.
