Weather chart
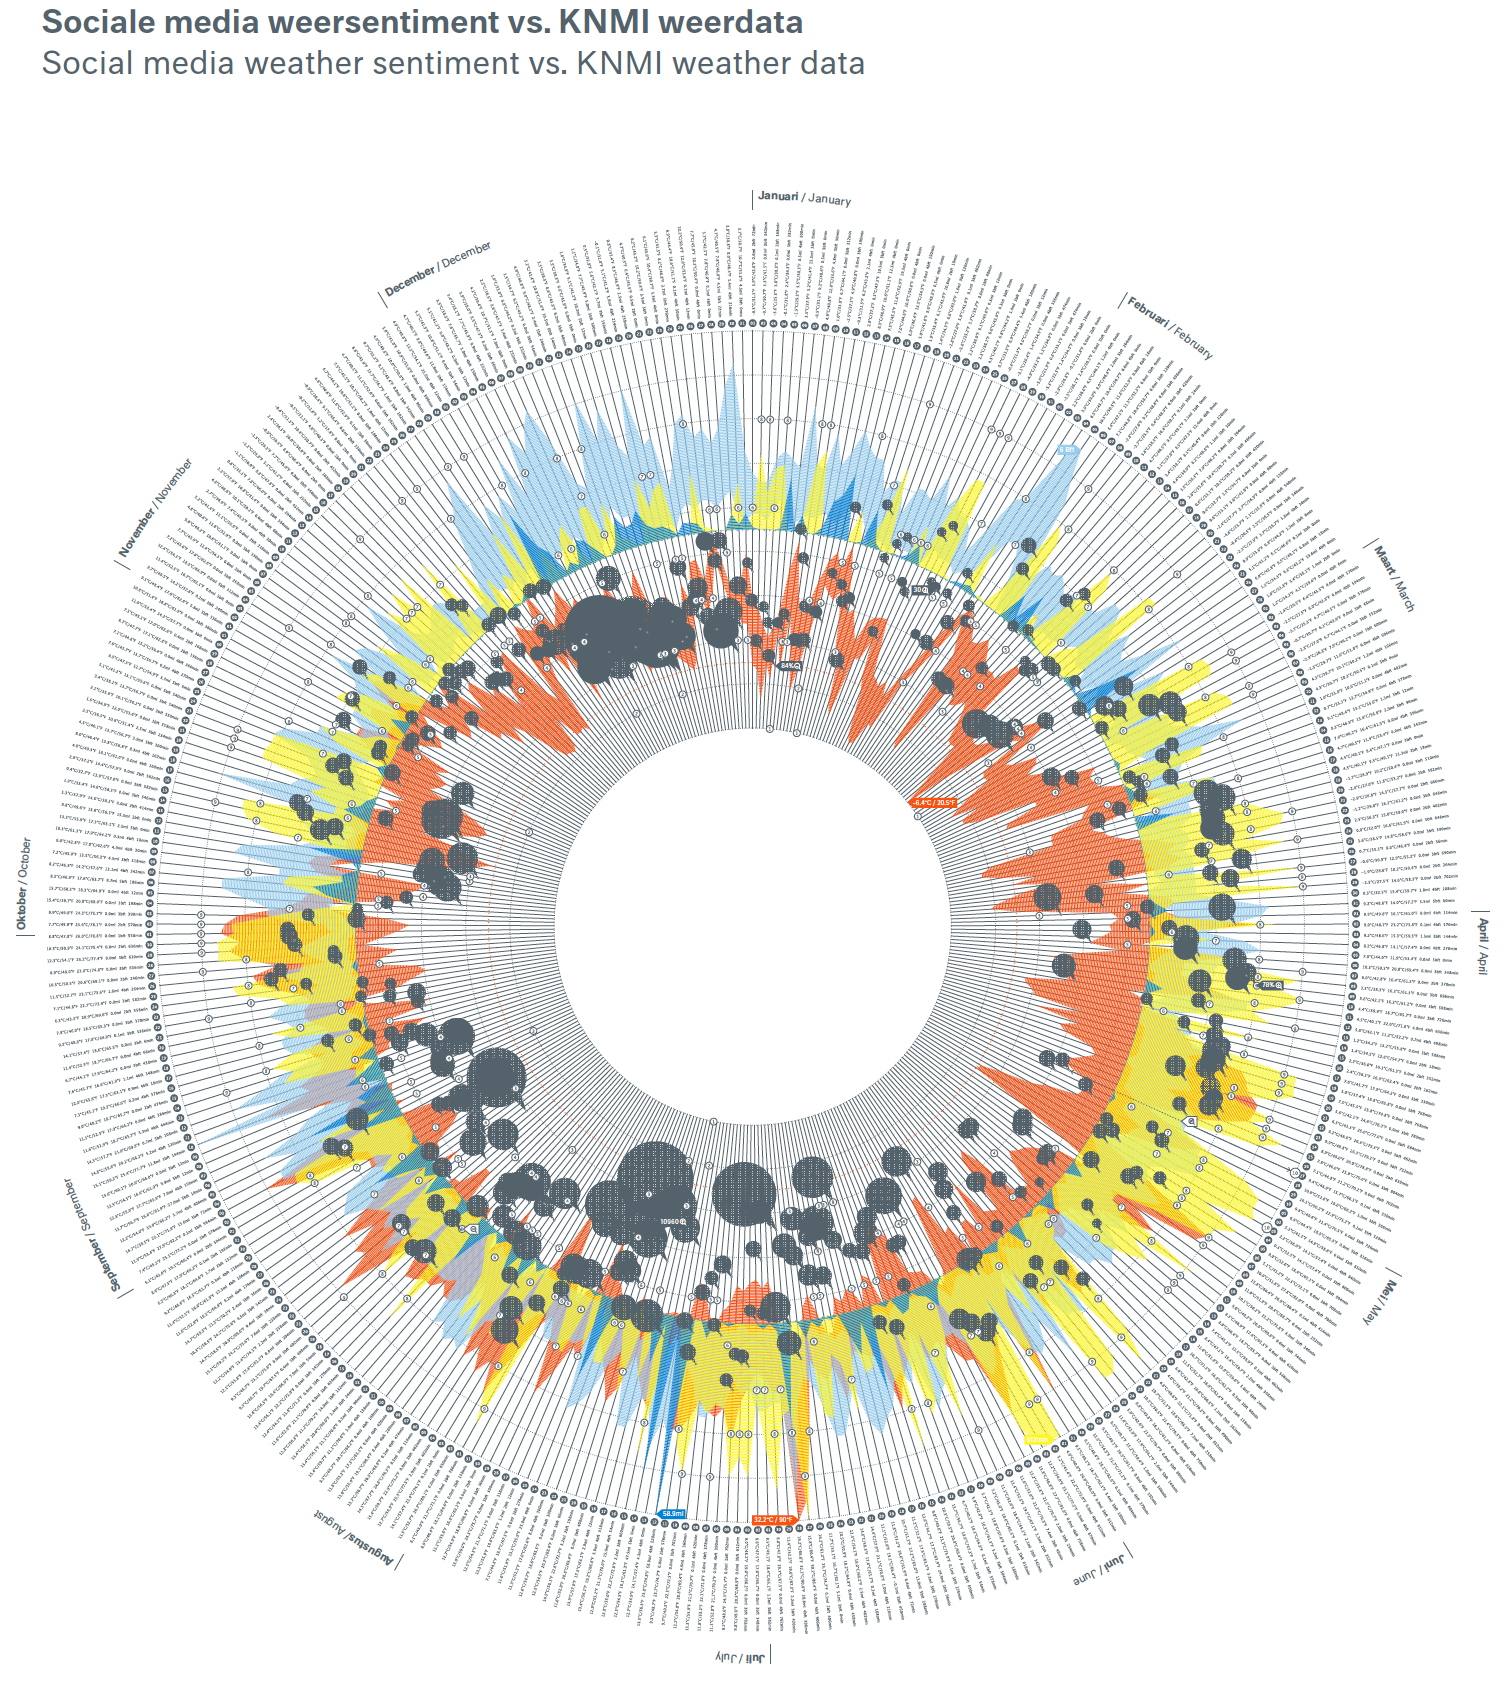
Printed poster-sized infographic exploring various aspects of weather patterns across the globe, including maps of weather extremes and global ranking of countries based on average temperature (between 1962 – 2012).
Making sense
of data visualisations
Printed poster-sized infographic exploring various aspects of weather patterns across the globe, including maps of weather extremes and global ranking of countries based on average temperature (between 1962 – 2012).