What we did on Seeing Data
On Seeing Data we used a range of research methods to help us answer our research questions and find out about how people interact with data visualisations. Methods included:
- Experimental practice: working with the Migration Observatory at the University of Oxford, we commissioned Clever Franke, a Dutch a visualisation agency to make visualisations of two datasets: a) ONS data about migration in the UK and b) textual data gathered by the Migration Observatory about word co-location in reporting about migration in the British media (that is, what words commonly precede and follow the word ‘migration’ (or related words). We evaluated these in our focus groups.
- Social semiotic analysis of visualisations: we did this in order to understand the semiotic resources that visualisers draw on to produce visualisations, and the digital & semiotic infrastructure of visualisations.
- Interviews with 13 visualisation professionals around the world to understand factors in the production process that affect engagement (for example, how they think about users when they produce visualisations, where they get their ideas about users and about what works and doesn’t work, what skills they think users need to make sense of visualisations).
- Diary keeping and focus groups with people engaging with visualisations (or who we might call ‘users’)
- There were 46 participants in 9 focus groups.
- They were asked to keep a diary for a week in advance of the focus group, of everyday encounters with visualisations, as a way of introducing them to what visualisations are and where they might be found.
- In focus groups, we showed participants eight visualisations (available here: seeingdata.org/vis). Criteria for selection of visualisations included: subject matter (we aimed for a range); format (interactive, static, animated); location (print, online, familiar media or not); chart type (we wanted a range); and we wanted to include at least one which is gamified/personalised and at least one which had a controversial reception.
- We asked participants to take notes of their responses as they looked,focusing on what they felt and what they learnt, giving them questions to prompt them. We then discussed their responses in detail.
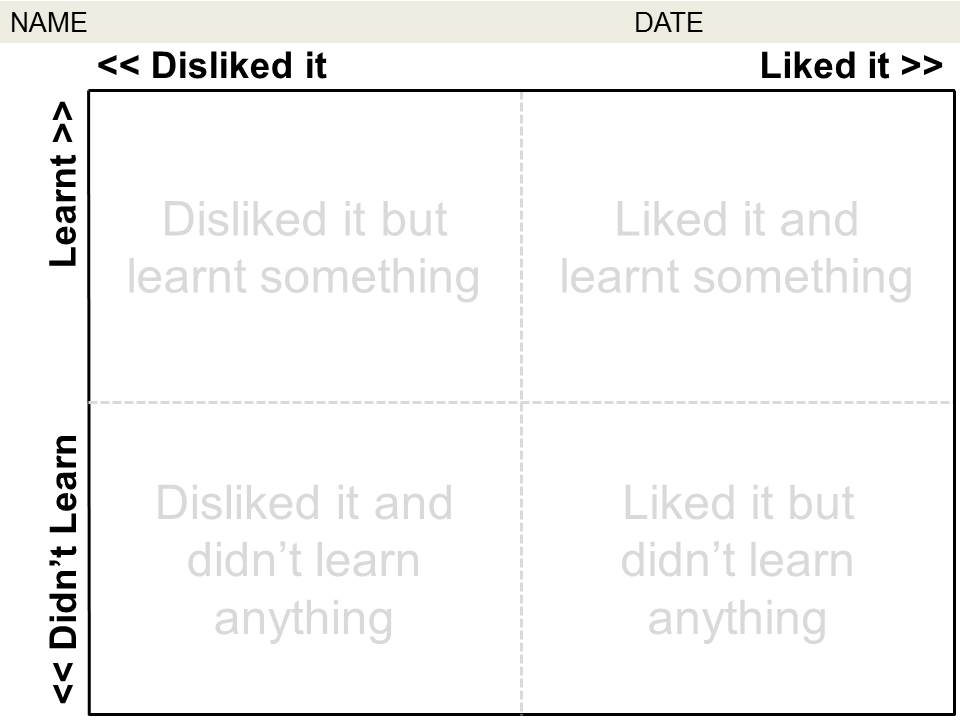
- Talking Mats: in the focus groups, we used Talking Mats, a tool developed to capture the feelings and opinions of people who may not be able to articulate these things verbally, to enable participants to articulate their responses to visualisations in ways that they might not be able to capture in written words. We asked participants to place thumbnail images of the visualisations on a talking mat like the one below. We used them as a visual way for participants to share their initial reactions with each other (so they could show each other where they had positioned the thumbnails) to initiate dialogue.
- Longer term diary-keeping and interviews: seven visualisation ‘users’ from the focus groups carried on participating in our research, keeping a diary of everyday encounters for four weeks and participating in an interview with us at the end of that period.