Rate these visualisations!
Tell us what you think of the visualisations that we used in our focus group research. Instructions below!What to do
- Look at the visualisations by clicking on the images below. You can choose to open the visualisation in a NEW tab or window (we recommend this) or view it in a pop-up window if you prefer to stay on this page. Some are interactive (i) and some are static (s).
- Place the images on the grid. When you’ve looked at one, go to the grid and position the image according to whether you liked or didn’t like and learned or didn’t learn something from the visualisation (‘learning something’ could also mean confirming something you already knew). Only place the visualisations that you have looked at onto the grid. Click SUBMIT.
- Compare your views with others. You can compare your responses to the visualisations with those of others, by clicking COMPARE.
Visualisations
-
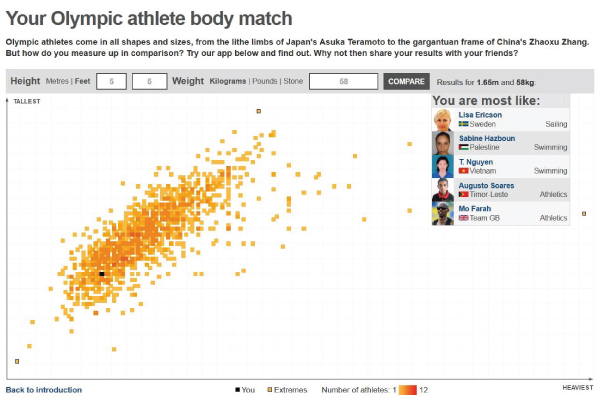
Your Olympic Athlete Body Match, BBC online.
 Open visualisation: new same window i
-
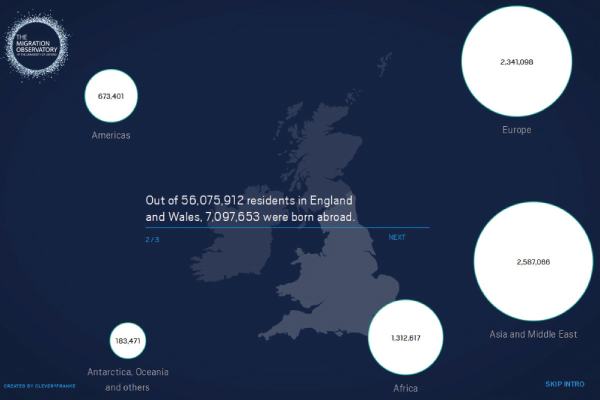
Migration In The Census, produced for The Migration Observatory, University of Oxford
 Open visualisation: new same window i
-
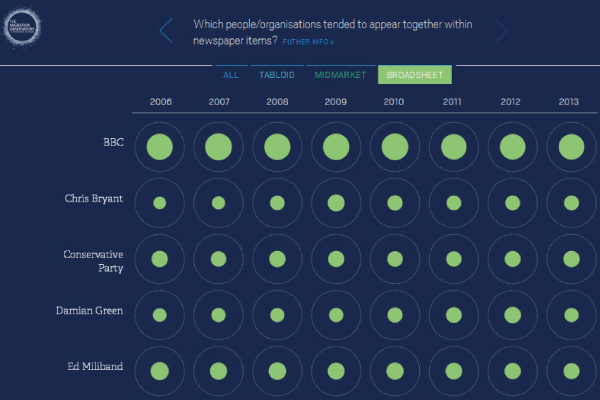
Migration In The News, produced for The Migration Observatory, University of Oxford
 Open visualisation: new same window i
-
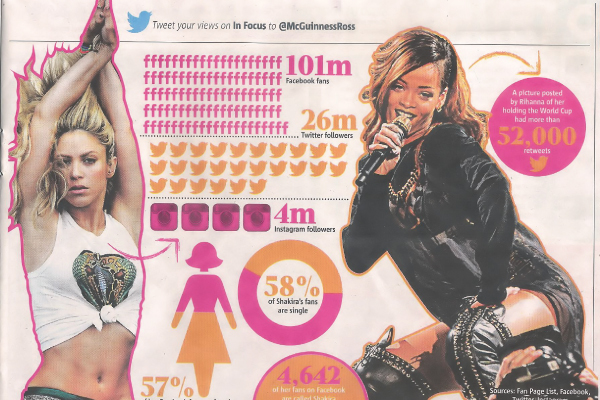
The Clicks Don’t Lie, The Metro newspaper.
 Open visualisation: new same window s
-
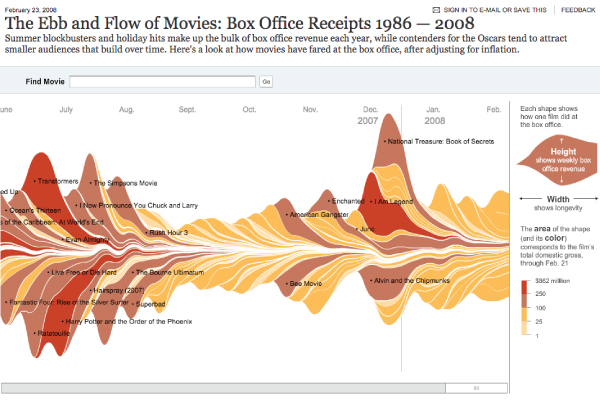
The Ebb & Flow of Box Office Receipts, 1986-2008, New York Times
 Open visualisation: new same window i
-
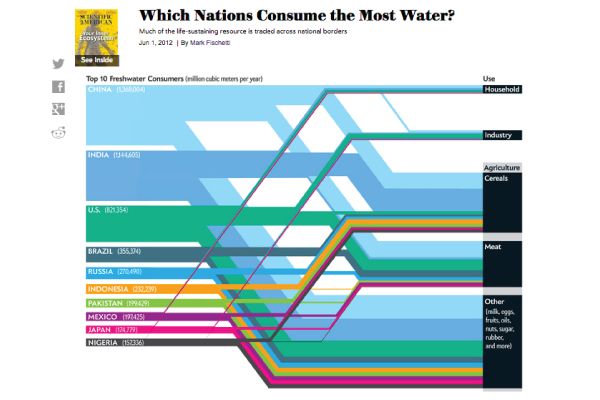
Top Ten Freshwater Consumers, Scientific American magazine
 Open visualisation: new same window s
-
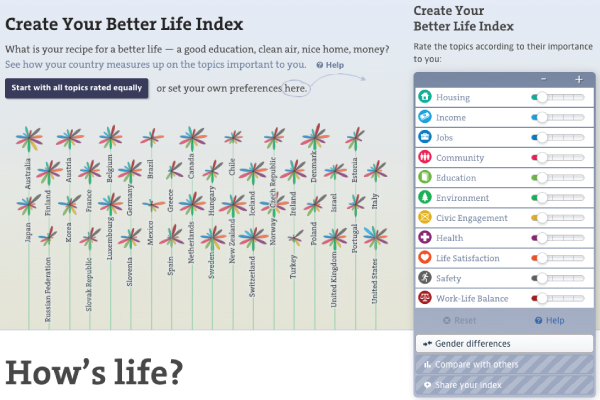
Better Life Index, The Organisation for Economic Co-operation and Development (OECD).
 Open visualisation: new same window i
-
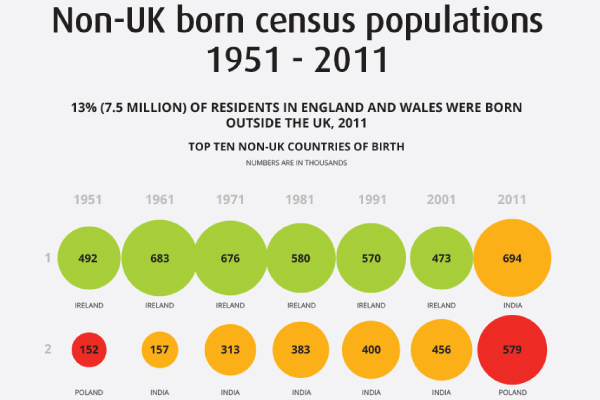
Non-UK Born Census Data, Office for National Statistics (ONS)
 Open visualisation: new same window s