Taking time with visualisation
Let’s begin!
Before we get in to the nuts and bolts of reading the visualisation charts themselves, we need to consider what is going on ‘outside’ the chart. This means thinking about more general matters such as the subject matter of the visualisation, where the visualisation is located and who made it, and where the data comes from.
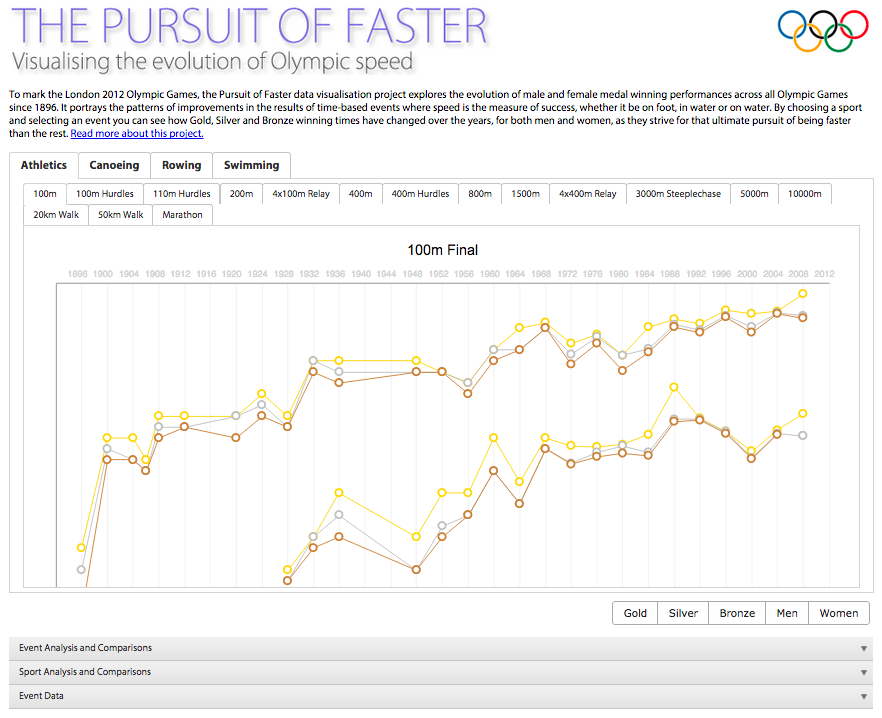
To help illustrate this section we’ll use an example: ‘The Pursuit of Faster’ by Andy Kirk and Andrew Witherley. ‘The Pursuit of Faster’ explores the improvement in medal winning times across a range of Olympic events over time. It is a web-based interactive visualisation and we encourage you to visit it in its orginal location and to play with its interactive elements: http://www.visualisingdata.com/olympics/thepursuitoffaster.html. For the purpose of this guide we will use various static screen shots.
In this section you can use the buttons above to find out about:
- Format and task size
- Titles, URL & author
- Introductions & guides
- Layout
- Data sources and treatment
- Interactive features