Taking time with visualisation
Bar chart
What it shows
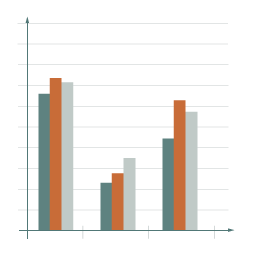
The bar chart uses bar length to represent quantitative values for a range of different categories. You might use a bar chart to show the number of films made by different movie stars, for example.
How to read it
Judge the absolute length of each bar by cross-referencing against the scale along an axis or a value label. Then compare all the bars, looking out for the big ones through to the small, the normal ones and the exceptions.
Things to beware
The length of a bar should always be representative of the underlying value – if the base of the bar is not at ‘zero’ be careful not to misinterpret the significance of the difference between bars. Charts should not be presented using faux-3D effects. If you have to read a 3D chart be aware of the difficulty in adjusting your view to compensate for inflated and deflated bar sizes caused by perspective.
Alternative
Sometimes, a bar is replaced by a series of images or symbols stacked up in units to represent a value. This type of chart is commonly know as a Pictogram.